Price Monitor
Displays real-time data for your active token, along with wallet activity and overall trading performance.
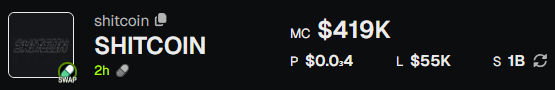
Token Details
At the top of the panel, you’ll see:
- Metadata - token name, symbol, and icon.
- Social Links - X (Twitter), Telegram, Website (if provided).
Token Price Data
PumpKit shows live trading metrics for every active token:
- MC (Market Cap) - current market capitalization.
- BC (Bonding Curve %) - progress of the bonding curve.
- P (Price) - live token price.
- L (Liquidity) - size of the liquidity pool.
- S (Supply) - circulating token supply.
Wallet Activity Summary
Below token details, the panel aggregates all wallet activity for the active token:
- Bought - total SOL spent.
- Sold - total SOL cashed out.
- Holding - current token value across wallets.
- PnL (Profit & Loss) - your net performance (realized + unrealized).
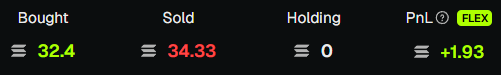
This gives you a global overview of your positions in real time.
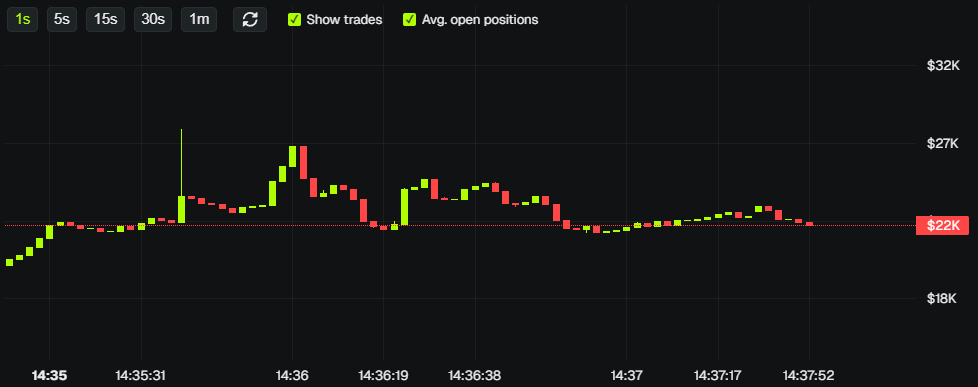
Candles Chart
A candlestick chart shows price history for the active token:
- Open/close, high/low for each period.
- Zoom and pan to analyze price action.
- Helps identify support, resistance, and trends.
Livestream
For eligible tokens, you can livestream your token creation:
- Set up RTMP credentials for your stream.
- Go live when creating a token to share the launch in real time.
- Access via the video icon in the Price Monitor area when a token supports it.
💡 Notes & Tips
- To switch tokens, use Token Search or Trending Tokens - the monitor will automatically update.
- Keep an eye on PnL to quickly assess if your positions are profitable.
- The Candles Chart uses historical data - may lag slightly for very new tokens.
- Livestream is available for supported launchpads - check eligibility before launching.