Trade History
View a complete overview of your past trades, including PnL tracking, execution details, and filters to analyze your performance.
Access
User Menu → Trades
Trading Overview
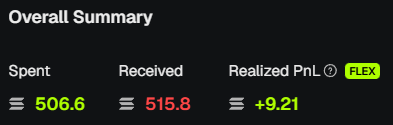
At the top, you’ll see a summary of your trading performance:
- Spent - Total SOL spent across all buys.
- Received - Total SOL received from sells.
- Realized PnL - Net profit/loss from completed trades (after fees).
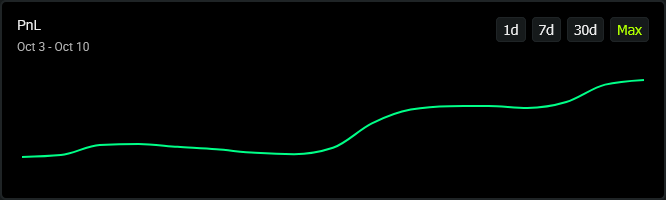
PnL Chart
A visual timeline of your profit and loss performance.
- Switch between ranges: 1d, 7d, 30d, Max.
- Track overall growth or losses over time.
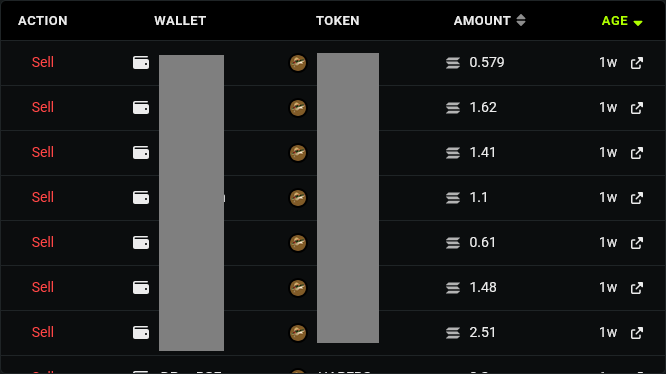
Trades Table
Each trade is listed with full details:
- Action - Buy or Sell.
- Wallet - Wallet that executed the trade.
- Token - Token traded (icon + mint reference).
- Amount - SOL (for buys) or tokens (for sells).
- Age - How long ago the trade happened.
- Link - Explorer link to the transaction signature.
Filters
- All Actions - Filter for buys, sells, or both.
- Top Tokens / All Tokens - Focus on your top trades or see everything.
- Reset - Clear filters and return to full history.

Pagination & Results
- Adjust how many trades to display per page (10, 20, 30, 50).
- A results counter shows your total trade count.
PnL Generator
Generate a shareable PnL image for your trading performance:
- Click Generate to create an image showing Spent, Received, PnL, and Position.
- SOL or USD view - Toggle between SOL and USD amounts.
- Hide filter title - Optionally hide the time/token filter label on the image.
- Copy - Copy the image to clipboard for sharing (e.g., on X or Discord).
The image reflects your current filters (time range, token, wallet). Use it to share your results without exposing raw data.
💡 Notes & Tips
- Amounts respect your Include fees in PnL setting in User Settings.
- Use filters to zoom in on specific tokens or wallets.
- The PnL chart reflects only realized PnL (not unrealized).
- For unrealized holdings, check the Price Monitor instead.